Alliant Business Intelligence (BI)

A new and enhanced way of getting and reviewing data stored in the Alliant Database, with AlliantBI Dashboards and Reports.

  AlliantBI®

Book a call
Alliant BI image 2

This is the future of Alliant!

Access real-time data and customizable dashboards with AlliantBI, empowering your team to make informed decisions quickly and effectively, just like a Modern Laundry should have it.

AlliantBI-main
Data

Data at your fingertips

Alliant BI places deep, actionable data right where you work—no delays, no digging through spreadsheets. Instantly access key data all in one live dashboard. Whether you're in the office or on the road, data-driven decisions happen now, not later. It’s the next step in giving textile rental operators maximum insight and agility—making Alliant the future of smarter, faster business management.

Easy

Easy customizable

Every operator runs differently—that’s why Alliant BI adapts to you. Tailor your workspace with drag‑and‑drop reports, personalized KPIs, and relevant visualizations that match your role—whether you’re a route supervisor, plant manager, or CFO. Customize notifications, filters, and drill‑down paths to highlight what matters most to your operation. With personalization up front, Alliant BI doesn’t just deliver data—it delivers your data, designed around your business so that it’s immediately impactful.

Web-Based

Web-based, it runs in your browser

Alliant BI is cloud-powered, browser-based, and ready wherever you are—at the plant, home, or out in the field. Access real-time insights via any device—desktop, tablet, or smartphone—with secure, centralized data that’s always current. It’s the modern, flexible, scalable way to bring Alliant into the future—today.
Request a demo

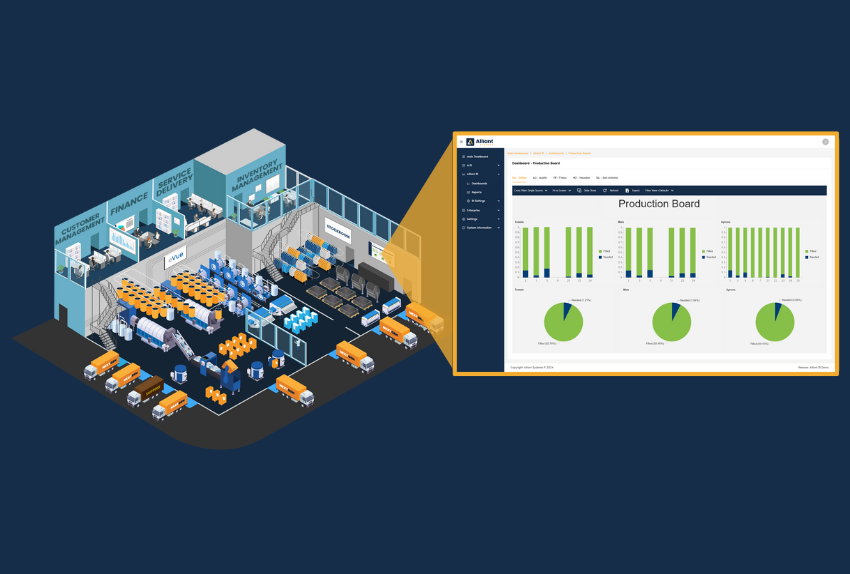
Now... imagine for a second

A meaningful dashboard in the center of your production floor with data out of Alliant Database that your staff needs to have right in the moment.

With this, your staff could be making better and faster decisions on the spot!

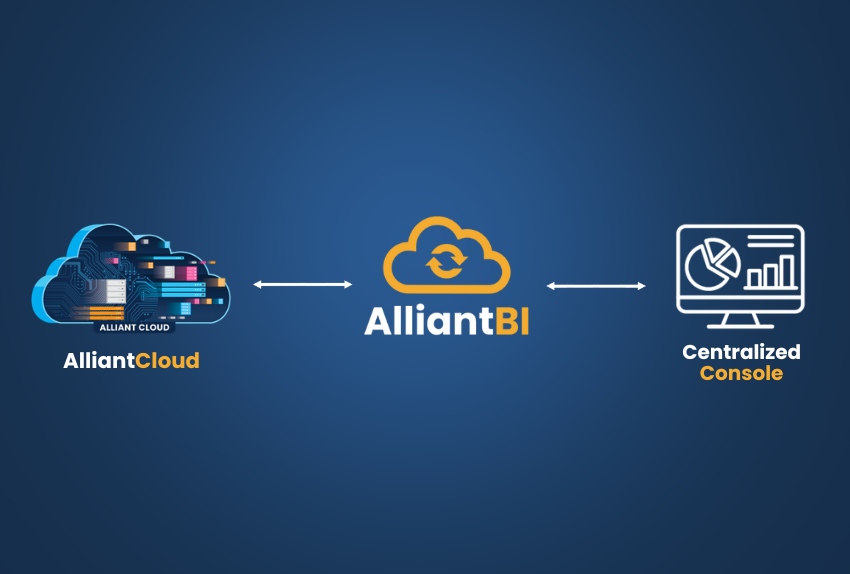
This will be possible thanks to AlliantBI, within the Centralized Console and AlliantCloud.

Alliant BI dashboard

Product Benefits

"It's all about making data clearer and more meaningful."

AlliantBI Functionalities

Data-Visualization

Data Visualization Components

Transform complex data into instantly understandable visuals with Alliant BI. From bar charts and line graphs to multi-series comparisons, our visualization tools help you turn numbers into meaning. Create dynamic graphics—like comparing two years of revenue by month—in just minutes. These visuals make it easier for your team to spot trends, uncover opportunities, and communicate insights clearly across the organization.

Drill

Drill-Down/Up

Get both the big picture and the fine details with powerful drill-down and drill-up capabilities. Start with high-level metrics—like total linen usage across all customers—and quickly zoom into a specific client, then further into individual locations or departments. With just a few clicks, you can explore your data at every level, helping you make decisions with both strategic oversight and operational precision.

Dashboard-Slides

Dashboard Slideshows

Say goodbye to manually updated Excel sheets or whiteboards. With Alliant BI’s dashboard slideshow feature, your key performance data can be displayed on monitors throughout your plant—automatically and in real time. Use large-format screens to cycle through live dashboards, keeping teams informed and aligned without lifting a finger. It’s a smarter, hands-free way to keep the floor connected to what’s happening across your operation.


Exports-into

Exports into multiple formats

Flexibility matters when it comes to sharing data. Alliant BI lets you export reports and dashboards in a variety of formats, making it easy to integrate insights into your existing workflows. Whether you're importing data into your accounting software or distributing reports to external partners, you’ll have the freedom to use your data where—and how—it works best for your business.
Role

Role/Permission-Based Access and Security

Protecting your data is a top priority. Alliant BI includes robust role- and permission-based access controls, so you decide who can view, edit, or create reports and dashboards. From frontline employees to executive leadership, each team member can access only what they need—ensuring data security, accountability, and peace of mind.

Scheduling-and-automation

Data Scheduling and Automation

Keep your inbox working for you with scheduled report delivery. Alliant BI allows you to automate the distribution of dashboards and reports straight to your email—daily, weekly, or on a custom schedule. No more logging in just to run the same reports—free up time and stay productive with insights that arrive when you need them.

How AlliantBI connects to my Data?

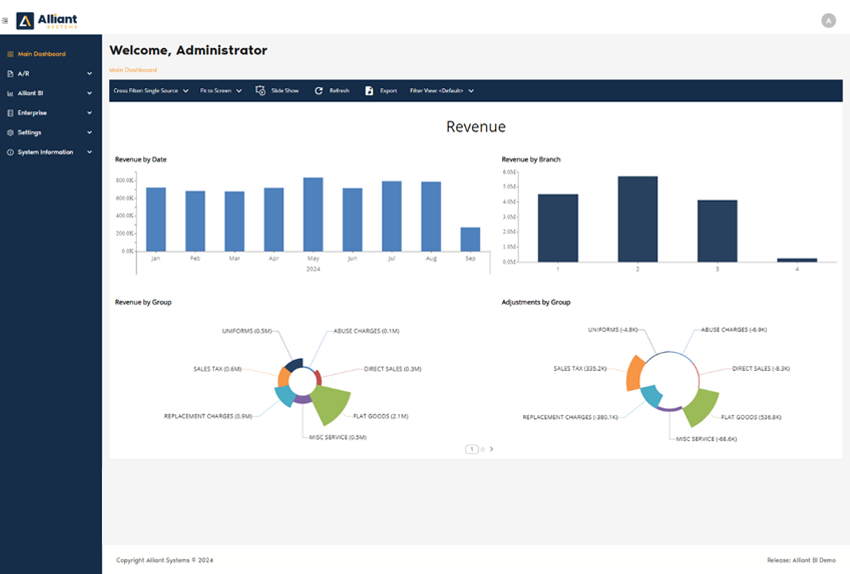
AlliantBI works really simple! The Alliant Cloud connects to AlliantBI... where the magic happens. And then you get access to Dashboards and Reports from within the Centralized Console... where the magic is shown!

Alliant BI image 4

What's included out of the box?

Resources like AlliantBI Training and Documentation, will cover everything from the simplest actions—like navigating the application—to creating your own complex reports tailored to your specific business needs. Whether you're a beginner or an advanced user, there will be step-by-step guides, tutorials, and best practices to ensure everyone can leverage the full potential of the tool.

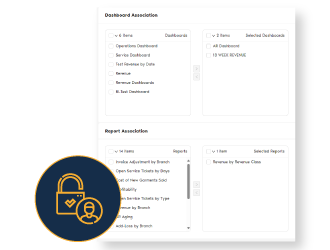
AlliantBI Pre-Built Dashboards and Reports will offer a list of dashboards and reports to Include with AlliantBI. Making sure to cover the different aspects of your business.

Book a call
Alliant-BI-(1)
AlliantBI logo (260 x 120 px)

Dashboards and Reports Included

Operations

Operations

Stay ahead of production challenges with real-time visibility into key operational metrics like open work orders, under-wash rates, and garment replacement costs. Instantly identify bottlenecks by drilling into specific routes, products, or vendors that consistently experience delays. For example, if FR garments are taking longer to fulfill, Alliant BI can help you pinpoint the source. These insights are designed to keep your plant running efficiently and proactively.

AR

A/R

Go beyond standard aging reports with a comprehensive view of your receivables. The A/R dashboard includes Day Sales Outstanding analytics, allowing you to track how quickly invoices are being paid—filtered by route, collector, or even internal team. With this level of granularity, your finance team can easily identify payment patterns, uncover delays, and take targeted action to improve cash flow.

SERVICE

Service

Gain full visibility into your service performance with dashboards that track tickets by status, type, and resolution time. Whether you’re monitoring overall service quality or focusing on a specific region or issue type, you can drill into the details to see where tickets are piling up—and why. This real-time view helps your team respond faster, resolve issues more effectively, and ensure a higher level of customer satisfaction.

revenue

Revenue

Get the full picture of your financial performance with interactive revenue dashboards. Track growth trends over time, compare performance by route, revenue class, or GL code, and drill down by branch, zip code, or even customer segment. Whether you’re looking for high-level insights or granular detail, Alliant BI puts your revenue data to work—so you can make smarter, faster business decisions.

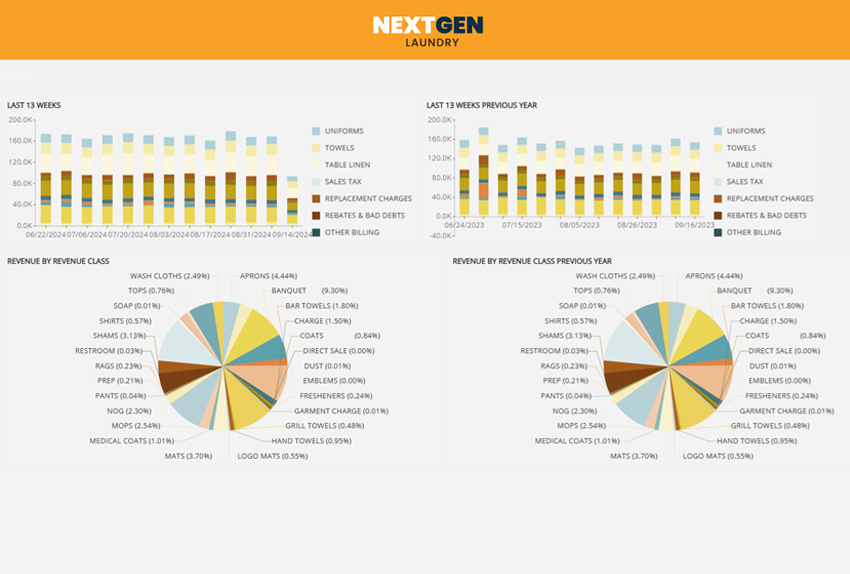
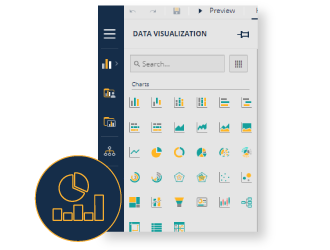
Discover Operational Insights with AlliantBI

With AlliantBI's advanced dashboards, you can:

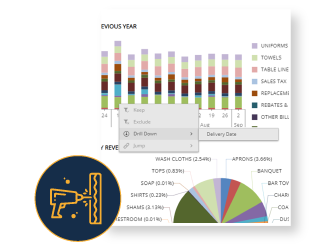
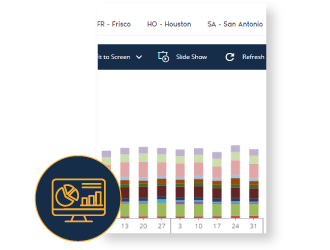
 Easily navigate and switch between plants
 Create your own parameters and filters to suit your specific needs
 Choose from a variety of viewing options
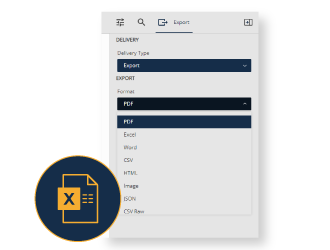
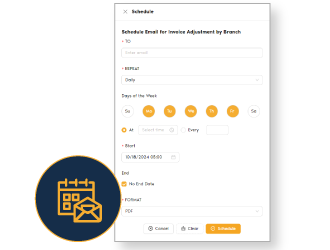
 Allows you to print reports, send them via a one-time email, and export the report in multiple formats such as PDF, Excel and even JSON


This comprehensive suite of tools provides you with detailed insights and automated reporting capabilities, empowering you to efficiently manage and optimize your operations with ease.

Discover-operational

It’s all about making data clearer and more meaningful!

Request a demo

Family of Products

Want to learn more?

WEB-TEMPLATE-3